
Using the Overdose Mapping Tool
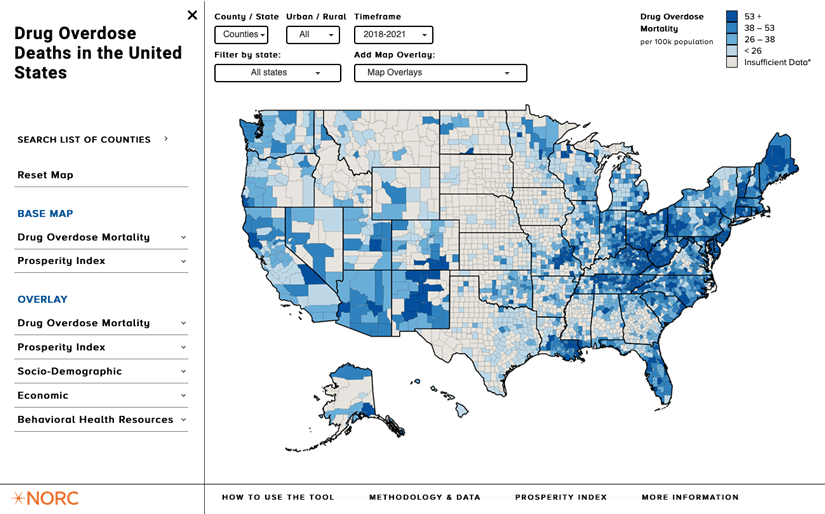
The Overdose Mapping Tool shares data and indicators on several factors related to drug overdose deaths in the United States and community and population demographics. The tool can help users create county-level maps illustrating fatal drug overdoses, including opioid overdose deaths, in relation to selected sociodemographic, economic, and behavioral health resources and data points. Maps and data insights derived from the Overdose Mapping Tool can be used to:
- Address gaps in resources
- Develop programs and strategies to address substance use disorder (SUD)
- Educate community members and stakeholders about overdose deaths in their community
All data included in the tool can be downloaded for free and additional data details are shared in the Methodology & Data tab of the tool. The tool includes the following indicators and data sources:
- Drug Overdose Mortality – Shares drug and opioid mortality rates from the Centers for Disease Control and Prevention (CDC)
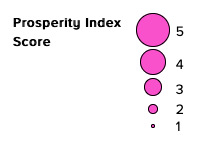
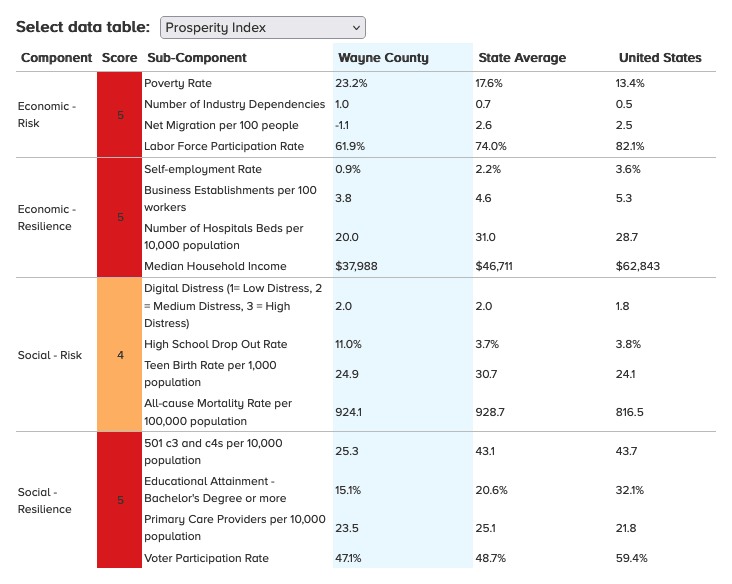
- Prosperity Index – Developed by the NORC Walsh Center for Rural Health Analysis, provides a single numerical measure designed to reflect the prosperity of a county based on 4 components: economic risk, economic resilience, social risk, and social resilience
- Socio-Demographic – Details data on age groups, race/ethnicity, education, disability status, broadband access, poverty, median household income, and unemployment from the U.S. Census American Community Survey (ACS)
- Economic – Statistics describing the percent employed in specific industries, including mining and natural resources, construction, manufacturing, and trade, transportation, and utilities from the U.S. Bureau of Labor Statistics
- Behavioral Health Resources – Data on mental health and substance use facilities per 10,000 population from the Substance Abuse and Mental Health Services Administration (SAMHSA)
Understanding the Data Features
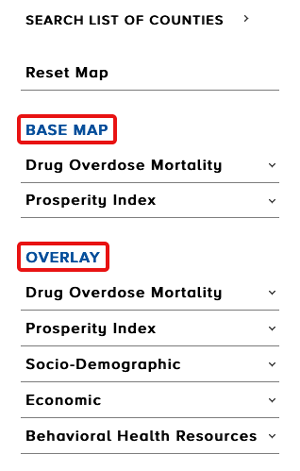
The Overdose Mapping Tool has 2 primary data features in the left sidebar:
- Base Map Indicators
- Overlays
For a Base Map Indicator, you can select from the Drug Overdose Mortality and Prosperity Index data to populate the first data layer of the map.
To add an Overlay, you can select the desired indicator to add as a second data layer to the map. The Overlay is added to the map as different sized pink bubbles with a legend in the top right of the map landing page. The Overlay allows you to observe the relationship between two indicators.
You can customize your map using the features at the top left of the map landing page.
- County/State – Use to see state-level Drug Overdose mortality Data and the Overlays, select State from the County/State drop-down menu.
- Urban/Rural – Select Rural to see only the rural counties in the United States.
- Timeframe – Drug Overdose Mortality data are available for 3 time periods: 2010-2013, 2014-2017, or 2018-2021. Use this drop-down to select Drug Overdose Data you are interested in viewing. Multiple years of data are used to maximize the number of counties that will have data in the tool.
- Filter by State – Allows you to select a single state to view on the map. When you select a state, the tool will adjust the data to show the distribution of Drug Overdose Mortality for that specific state, instead of normalized to the United States rates.
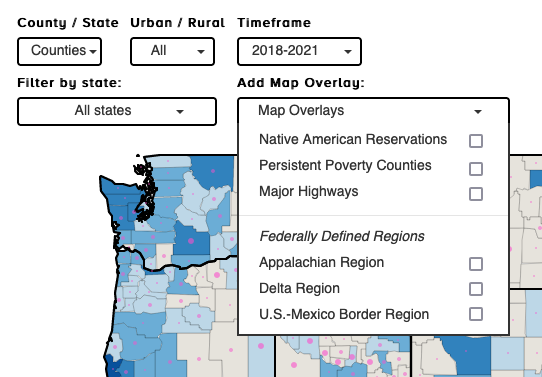
- Add a Map Overlay – These map Overlays will appear as geographic boundaries on the map to provide additional context. For example, if you are interested in seeing the location of tribal lands, you can add the Native American Reservations Overlay.
Finding Your County Data
You can find your county’s data in 2 ways:
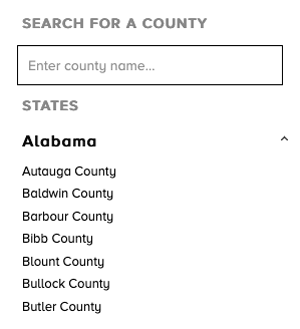
- Search – By county name or select it from the drop-down menu under each state. When
you click on the county, the County Profile Page will appear in a pop-up window.
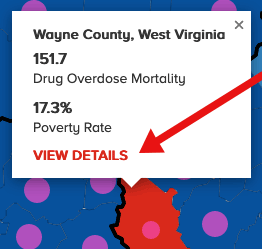
- Click – In the map to view, click on a county to view the county-level data for the
selected indicators. Clicking on the “View Details” text will make the County Profile Page appear in a
pop-up window.
Exploring the County Profile Page
The County Profile Page includes all the tool’s data for the selected county and allows you to compare it to your state and the United States, as a whole, in the data table.
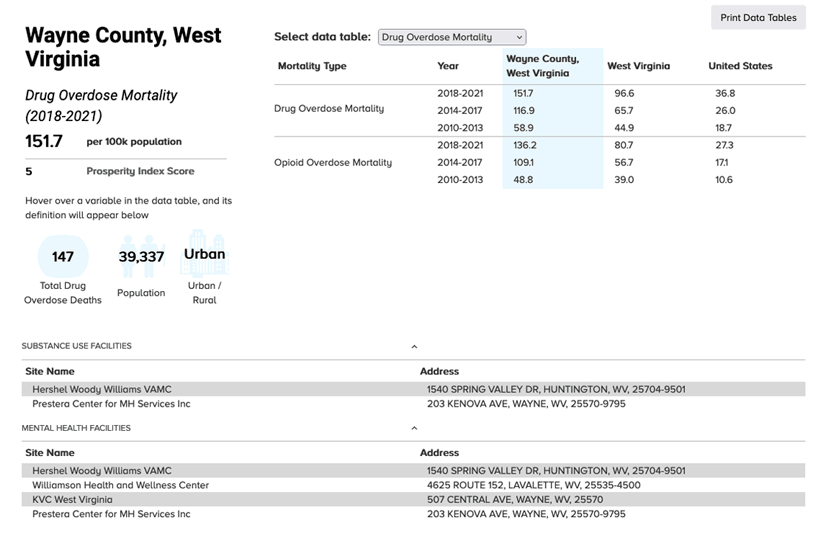
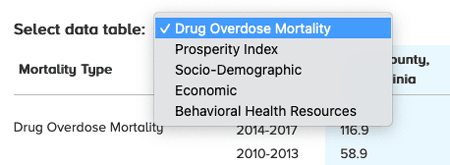
Use the drop-down menu to change the Overlay data.
When selecting the Prosperity Index, you can view all 4 components and the overall scores. Additional details on the development and methodology of the Prosperity Index indicator is shared in the Prosperity Index tab of the tool.
At the bottom of the County Profile Page, you can view the name and address of substance use and mental health facilities in the selected county.
Using Data to Drive Action
There are several ways you can use the results of the Overdose Mapping Tool to identify both the needs and strengths of your community as they relate to efforts to address drug overdose deaths, substance use and misuse, and contributing factors, including:
- Apply for Funding – Explore the mapping tool to gather relevant data for your community that can be used for applications for grants or federal funding.
- Identify Needs – Use the information gathered to begin having discussions about strengths and weaknesses in your community, identify areas that may need improvement, and begin discussions to address the issues or areas of concern. For example, you can use the Behavioral Health Resources Overlay data to determine where gaps in behavioral healthcare providers may exist.
- Share Information – Share your findings with decision makers. The County Profile Page can be used as a tool to share data with policymakers and other decision makers in your community to drive action.